In this Avaprimax article, we describe types of Japanese candlesticks, and explain how to read them. Check out our tips on how to trade Japanese candlesticks.
One of the most tested, popular and effective trend-trading setups is the flag pattern. When the market is trending down a trader is looking for a bearish flag pattern and when the market is trending up, the trader wants a bullish flag pattern.
When the market is trending, traders are looking to “ride the trend”. The way to do that is to find a continuation pattern. A bull flag is a continuation pattern for when the market is trending up and a bear flag is a continuation pattern for when the market is trending down.
Even when the market is clearly trending, it never moves in one direction only. A trending chart is a series of impulse moves and pullbacks. The big jumps in the market are the impulse moves that either start a trend or continue it. But “what goes up eventually has to come back down”, and the market typically retraces part of the move before continuing in the trend’s direction.
The trick to trading the bull flag or the bear flag is to wait for the pullback to come to an end and trade the continuation of the trend.
Although flag patterns come in all different shapes and sizes, every flag pattern has two parts: a flagpole and the flag. There are three main types of flag. In a bullish chart, the three main bull flags are:


Now let's examine bear flags. There are three main types of bear flags:


It’s important to note that a setup always needs a confirmation signal. In other words, even after identifying a flag pattern a good trader has a signal - either a specific candle or maybe a set of candles - that he's looking for before executing the trade.
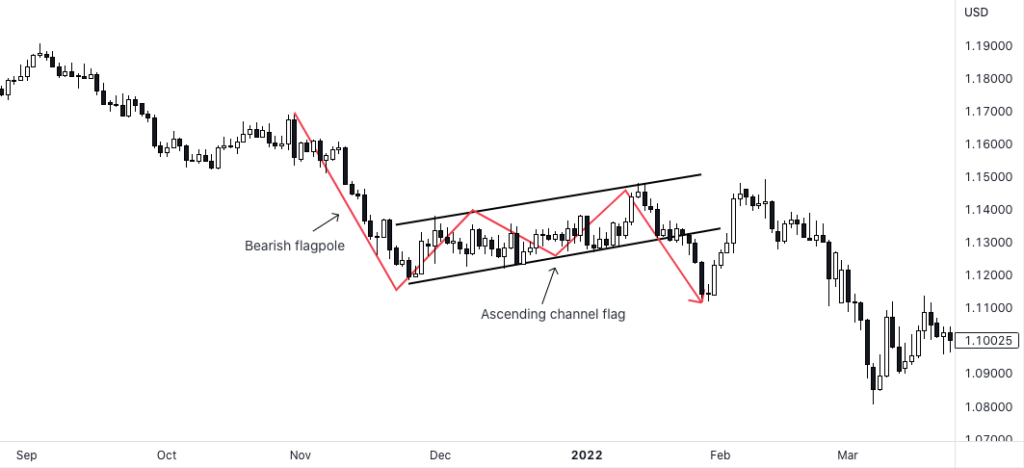
Take a look at this bear flag on the Daily chart of the EUR/USD: Notice the flagpole and the channel. Note how the last 4 candles in the channel before the price action continued downward were all small candles. The market was clearly indecisive for those last four days before it broke out. That “pressure” might be a signal for a trader that the channel is coming to an end and the market will continue downward.

Here’s another example of a bullish descending channel flag from the CAD/JPY 5M chart. Here again you see the ascending flagpole followed by the descending channel flag and then the breakout:

Let’s take a closer look at the breakout and we can see some clues of it coming. Notice how the lows in the channel were ascending. Then there was a big wicked candle showing bullish pressure. After that wick, there was clear indecision in the market right at the top of the channel followed by the breakout.

Identifying these patterns is the first step in trading them, but for a higher winning percentage a trader wants to find clues and signals within the candles themselves to give himself a better edge.
We hope this lesson in bull flags and bear flags helps you develop that edge you’re looking for. Always remember that the trend must take a pause before continuing. Successful traders don’t chase the trend but wait for pullbacks. Then they identify patterns, like these flag patterns and finally they see a confirmation candle, or set of confirmation candles, before triggering and opening their winning positions.

In this Avaprimax article, we describe types of Japanese candlesticks, and explain how to read them. Check out our tips on how to trade Japanese candlesticks.
4 most popular continuation trading patterns that every trader should know. Check out types of continuation patterns and read about bullish and bearish continuation candlestick patterns on the Avaprimax Blog.
6 most popular reversal trading patterns that every trader should know. Double top and bottom, engulfing pattern, and other Forex reversal patterns on the Avaprimax Blog.
Read about key differences between chart patterns and candlesticks. Find out types of chart and candlestick patterns on the Avaprimax Blog.
Our experts have compiled 6 of the most popular trading patterns that every trader should know. Сup and handle pattern, head and shoulders chart, and other Forex chart patterns on the Avaprimax Blog.
